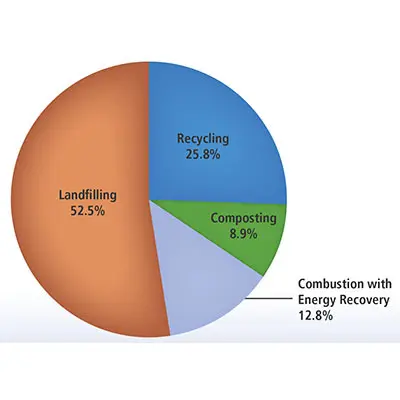
This pie chart shows the outcomes of e-waste after disposal.
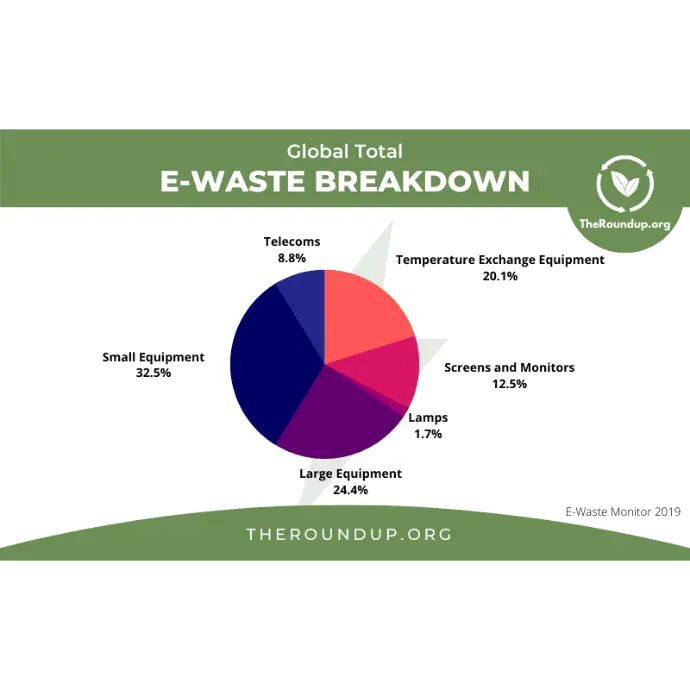
This Pie chart shows that E-Waste is generated from different things.
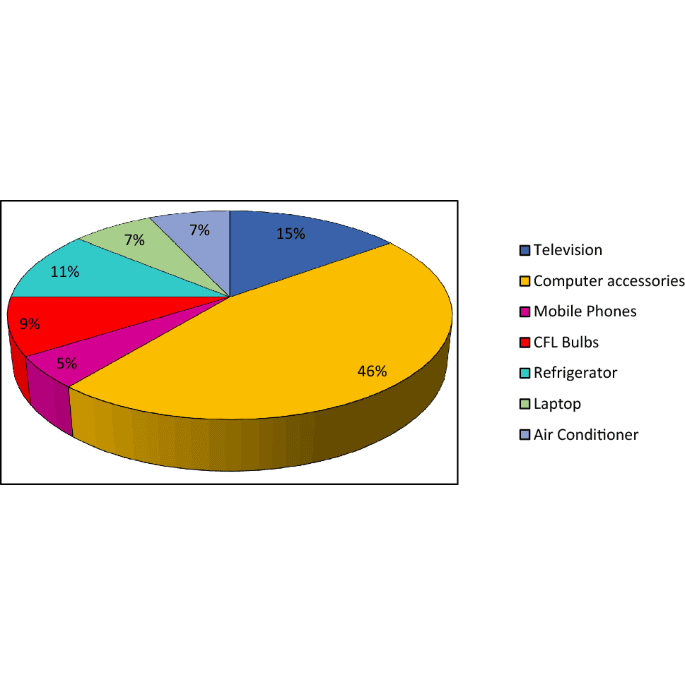
This Pie chart shows from which things(electronic things) E-Waste is generated.